gc日志概述
java虚拟机实现了内存自动管理机制,而该机制会帮我们程序员自动进行内存分配和回收,并且回收过程种会产生STW(Stop The World),暂停整个jvm,从而影响我们程序的吞吐量和响应耗时,所以构建java程序时,我们有必要关系gc的运行情况,从而解决gc的问题提升程序的性能。
jdk提供了jstat和gc日志等多种手段来查看gc信息,jstat可以快速查看堆占用情况和gc次数等统计信息,而其中信息最完备的当属gc日志,通过它,我们可以轻松计算处下列关键gc指标
- 吞吐率
- gc耗时
- 平均耗时
- 最大耗时
- 对象平均晋升年龄
- 对象分配速率
jstat 信息
~ jstat -gcutil 1463 1000 1000
  S0     S1     E      O      M     CCS    YGC     YGCT    FGC    FGCT     GCT
 20.69   0.00   4.00  48.73  98.46  97.93  11942  123.757    27    2.852  126.608
 20.69   0.00   4.88  48.73  98.46  97.93  11942  123.757    27    2.852  126.608
 20.69   0.00   5.46  48.73  98.46  97.93  11942  123.757    27    2.852  126.608
 20.69   0.00   6.10  48.73  98.46  97.93  11942  123.757    27    2.852  126.608
 20.69   0.00   7.03  48.73  98.46  97.93  11942  123.757    27    2.852  126.608
 20.69   0.00   7.50  48.73  98.46  97.93  11942  123.757    27    2.852  126.608
 20.69   0.00   8.13  48.73  98.46  97.93  11942  123.757    27    2.852  126.608
 20.69   0.00   9.06  48.73  98.46  97.93  11942  123.757    27    2.852  126.608
 20.69   0.00   9.68  48.73  98.46  97.93  11942  123.757    27    2.852  126.608
 20.69   0.00  10.69  48.73  98.46  97.93  11942  123.757    27    2.852  126.608
 20.69   0.00  11.26  48.73  98.46  97.93  11942  123.757    27    2.852  126.608
 20.69   0.00  12.30  48.73  98.46  97.93  11942  123.757    27    2.852  126.608
 20.69   0.00  12.83  48.73  98.46  97.93  11942  123.757    27    2.852  126.608
 20.69   0.00  13.58  48.73  98.46  97.93  11942  123.757    27    2.852  126.608
 20.69   0.00  14.57  48.73  98.46  97.93  11942  123.757    27    2.852  126.608
gc日志分析结果
所以下文将围绕gc日志展开描述。
开启gc日志
jdk8 以下版本(包含jdk8)
先给实例:
-XX:+PrintGCDetails -Xloggc:<gc-log-file-path> -XX:+UseGCLogFileRotation -XX:NumberOfGCLogFiles=n -XX:GCLogFileSize=n

示例:

-XX:+PrintGCDetails -Xloggc:/dev/shm/service-gc.log -XX:+UseGCLogFileRotation -XX:NumberOfGCLogFiles=5 -XX:GCLogFileSize=5m
逐个解析参数含义:
- PrintGCDetails : 代表打印gc详情和时间
- Xloggc : gc日志文件的保存目录
- UseGCLogFileRotation : 代表启动日志轮转,避免gc文件越来越大
- NumberOfGCLogFiles : 代表轮转日志文件最多保留多少个
- GCLogFileSize : 代表每个gc文件大小阈值,到达该阈值时,出发轮转
jdk9 以及以上版本
先给实例:
-Xlog:gc*:file=<gc-log-file-path>

示例:

-Xlog:gc*:file=/dev/shm/service-gc.log
之所以jdk9以后gc日志的参数变更了,是因为jdk9中的两个提案:JEP158和JEP271,给出了标准化的gc参数和日志格式,解决了以往jdk中因为历史原因添加的各种垃圾回收器以及对应的日志格式不同的问题。
该提案给出的标准参数格式为
-Xlog[:[selections][:[output][:[decorators][:output-options]]]]
新的参数格式使用冒号分割,总共分为 selections,output,decorators,output-options 四部分。
selections 包含tag和level
tag 列表
- add
- age
- alloc
- annotation
- aot
- arguments
- attach
- barrier
- biasedlocking
- blocks
- bot
- breakpoint
- bytecode
- census
- class
- classhisto
- cleanup
- compaction
- comparator
- constraints
- constantpool
- coops
- cpu
- cset
- data
- defaultmethods
- dump
- ergo
- event
- exceptions
- exit
- fingerprint
- freelist
- gc
- hashtables
- heap
- humongous
- ihop
- iklass
- init
- itables
- jfr
- jni
- jvmti
- liveness
- load
- loader
- logging
- mark
- marking
- metadata
- metaspace
- method
- mmu
- modules
- monitorinflation
- monitormismatch
- nmethod
- normalize
- objecttagging
- obsolete
- oopmap
- os
- pagesize
- parser
- patch
- path
- phases
- plab
- preorder
- promotion
- protectiondomain
- purge
- redefine
- ref
- refine
- region
- remset
- resolve
- safepoint
- scavenge
- scrub
- setting
- stackmap
- stacktrace
- stackwalk
- start
- startuptime
- state
- stats
- stringdedup
- stringtable
- subclass
- survivor
- sweep
- system
- task
- thread
- time
- timer
- tlab
- unload
- update
- verification
- verify
- vmoperation
- vtables
- workgang
可以使用all表示所有tag,可以使用+和,操作符拼接tag,+表示同时含有,,表示或者。可以使用*表示任意组合,比如gc*表示任何包含gc是事件.
如果你使用zsh(mac os x 就是用zsh),zsh不支持通配符,在使用gc时会报错。需要在通过vim ~/.zshrc中添加setopt nonomatch启用*通配符功能,重启终端或者source ~/.zshrc都可以让配置生效。
level 列表
- off
- trace
- debug
- info
- warning
- error
decorator 列表
- time
- utctime
- uptime
- timemillis
- uptimemillis
- timenanos
- uptimenanos
- hostname
- pid
- tid
- level
- tags
decorator 可以被指定为none
output 可以指定:stdout,stderr,file.分别为使用标准输出,错误输出以及输出到指定文件
output-options 为 filecount 文件数、filesize 文件大小,支持单位为k,m,g
日志异步输出
async表示启用日志异步输出,一步日志会将日志先输出到buffer中,然后由一个独立的线程完成日志输出.启用方式:-Xlog:async
实例
java -Xlog:gc -version

输出为:

[0.012s][info][gc] Using G1
java -Xlog:gc* -version

输出为:

[0.010s][info][gc] Using G1
[0.011s][info][gc,init] Version: 17+0 (release)
[0.011s][info][gc,init] CPUs: 8 total, 8 available
[0.011s][info][gc,init] Memory: 16384M
[0.011s][info][gc,init] Large Page Support: Disabled
[0.011s][info][gc,init] NUMA Support: Disabled
[0.011s][info][gc,init] Compressed Oops: Enabled (Zero based)
[0.011s][info][gc,init] Heap Region Size: 2M
[0.011s][info][gc,init] Heap Min Capacity: 8M
[0.011s][info][gc,init] Heap Initial Capacity: 256M
[0.011s][info][gc,init] Heap Max Capacity: 4G
[0.011s][info][gc,init] Pre-touch: Disabled
[0.011s][info][gc,init] Parallel Workers: 8
[0.011s][info][gc,init] Concurrent Workers: 2
[0.011s][info][gc,init] Concurrent Refinement Workers: 8
[0.011s][info][gc,init] Periodic GC: Disabled
[0.011s][info][gc,metaspace] CDS archive(s) mapped at: [0x0000000800000000-0x0000000800bd0000-0x0000000800bd0000), size 12386304, SharedBaseAddress: 0x0000000800000000, ArchiveRelocationMode: 0.
[0.011s][info][gc,metaspace] Compressed class space mapped at: 0x0000000800c00000-0x0000000840c00000, reserved size: 1073741824
[0.011s][info][gc,metaspace] Narrow klass base: 0x0000000800000000, Narrow klass shift: 0, Narrow klass range: 0x100000000
openjdk version "17" 2021-09-14
OpenJDK Runtime Environment Homebrew (build 17+0)
OpenJDK 64-Bit Server VM Homebrew (build 17+0, mixed mode, sharing)
[0.083s][info][gc,heap,exit] Heap
[0.083s][info][gc,heap,exit]  garbage-first heap   total 266240K, used 3368K [0x0000000700000000, 0x0000000800000000)
[0.083s][info][gc,heap,exit]   region size 2048K, 1 young (2048K), 0 survivors (0K)
[0.083s][info][gc,heap,exit]  Metaspace       used 51K, committed 128K, reserved 1056768K
[0.083s][info][gc,heap,exit]   class space    used 1K, committed 64K, reserved 1048576K
-Xlog:async -Xlog:gc=debug:file=app.log:time,tid,pid


标识启用异步输出,开启debug级别的gc日志,输出到app.log文件
输出为:

[2022-01-03T16:53:02.906+0800][47012][8707] Using G1
推荐的参数配置
jdk8 及更低版本
-XX:+PrintGCDetails -XX:+PrintGCDateStamps -Xloggc:{file-path}
jdk9+
-Xlog:async -Xlog:gc*:file={file-path}:time:fielcount=5,filesize=5m
gc日志分析
因为历史原因,HotSpot VM的GC日志比较混乱,每一套GC都有自己的日志格式,学习和成本较高。
例如,老版本 CMS + ParNew GC日志
2022-01-04T20:15:41.866+0800: 1901140.046: [GC (Allocation Failure) 2022-01-04T20:15:41.866+0800: 1901140.046: [ParNew: 1715835K->35176K(1887488K), 0.0067846 secs] 2184998K->504880K(2936064K), 0.0072324 secs] [Times: user=0.08 sys=0.00, real=0.01 secs]
2022-01-04T20:17:35.605+0800: 1901253.784: [GC (Allocation Failure) 2022-01-04T20:17:35.605+0800: 1901253.785: [ParNew: 1713000K->36570K(1887488K), 0.0074088 secs] 2182704K->506845K(2936064K), 0.0079097 secs] [Times: user=0.09 sys=0.00, real=0.01 secs]
2022-01-04T20:19:28.897+0800: 1901367.076: [GC (Allocation Failure) 2022-01-04T20:19:28.897+0800: 1901367.077: [ParNew: 1714394K->36399K(1887488K), 0.0075076 secs] 2184669K->507297K(2936064K), 0.0079488 secs] [Times: user=0.09 sys=0.00, real=0.01 secs]
2022-01-04T20:21:21.523+0800: 1901479.703: [GC (Allocation Failure) 2022-01-04T20:21:21.523+0800: 1901479.703: [ParNew: 1714223K->39200K(1887488K), 0.0086297 secs] 2185121K->510633K(2936064K), 0.0091131 secs] [Times: user=0.08 sys=0.00, real=0.01 secs]
2022-01-04T20:23:12.944+0800: 1901591.123: [GC (Allocation Failure) 2022-01-04T20:23:12.944+0800: 1901591.124: [ParNew: 1717024K->37555K(1887488K), 0.0076647 secs] 2188457K->509541K(2936064K), 0.0081210 secs] [Times: user=0.09 sys=0.00, real=0.01 secs]
2022-01-04T20:25:07.135+0800: 1901705.315: [GC (Allocation Failure) 2022-01-04T20:25:07.135+0800: 1901705.315: [ParNew: 1715379K->44081K(1887488K), 0.0093720 secs] 2187365K->516675K(2936064K), 0.0098416 secs] [Times: user=0.07 sys=0.02, real=0.01 secs]
2022-01-04T20:26:57.957+0800: 1901816.136: [GC (Allocation Failure) 2022-01-04T20:26:57.957+0800: 1901816.136: [ParNew: 1721905K->35301K(1887488K), 0.0073180 secs] 2194499K->508515K(2936064K), 0.0077758 secs] [Times: user=0.09 sys=0.00, real=0.01 secs]
2022-01-04T20:28:55.313+0800: 1901933.493: [GC (Allocation Failure) 2022-01-04T20:28:55.313+0800: 1901933.493: [ParNew: 1713125K->38342K(1887488K), 0.0074663 secs] 2186339K->512170K(2936064K), 0.0079034 secs] [Times: user=0.09 sys=0.00, real=0.01 secs]
2022-01-04T20:30:49.312+0800: 1902047.491: [GC (Allocation Failure) 2022-01-04T20:30:49.312+0800: 1902047.491: [ParNew: 1716166K->35155K(1887488K), 0.0073229 secs] 2189994K->509520K(2936064K), 0.0078184 secs] [Times: user=0.09 sys=0.00, real=0.01 secs]
2022-01-04T20:32:45.159+0800: 1902163.339: [GC (Allocation Failure) 2022-01-04T20:32:45.160+0800: 1902163.339: [ParNew: 1712977K->35999K(1887488K), 0.0085837 secs] 2187342K->510846K(2936064K), 0.0090983 secs] [Times: user=0.09 sys=0.00, real=0.01 secs]
老版本 G1 日志
11852.870: [G1Ergonomics (CSet Construction) start choosing CSet, _pending_cards: 0, predicted base time: 22.46 ms, remaining time: 177.54 ms, target pause time: 200.00 ms]
 11852.870: [G1Ergonomics (CSet Construction) add young regions to CSet, eden: 1179 regions, survivors: 49 regions, predicted young region time: 146.48 ms]
 11852.870: [G1Ergonomics (CSet Construction) finish choosing CSet, eden: 1179 regions, survivors: 49 regions, old: 0 regions, predicted pause time: 168.94 ms, target pause time: 200.00 ms]
2022-01-04T20:05:04.210+0800: 11852.905: [SoftReference, 0 refs, 0.0002872 secs]2022-01-04T20:05:04.210+0800: 11852.905: [WeakReference, 2179 refs, 0.0002888 secs]2022-01-04T20:05:04.211+0800: 11852.905: [FinalReference, 39422 refs, 0.0082813 secs]2022-01-04T20:05:04.219+0800: 11852.913: [PhantomReference, 0 refs, 16 refs, 0.0003884 secs]2022-01-04T20:05:04.219+0800: 11852.914: [JNI Weak Reference, 0.0002786 secs] 11852.917: [G1Ergonomics (Mixed GCs) do not start mixed GCs, reason: candidate old regions not available]
, 0.0473669 secs]
   [Parallel Time: 33.9 ms, GC Workers: 6]
      [GC Worker Start (ms): Min: 11852869.9, Avg: 11852869.9, Max: 11852870.0, Diff: 0.1]
      [Ext Root Scanning (ms): Min: 0.7, Avg: 2.0, Max: 8.1, Diff: 7.5, Sum: 12.2]
      [Update RS (ms): Min: 0.0, Avg: 0.0, Max: 0.0, Diff: 0.0, Sum: 0.0]
         [Processed Buffers: Min: 0, Avg: 0.0, Max: 0, Diff: 0, Sum: 0]
      [Scan RS (ms): Min: 0.1, Avg: 0.2, Max: 0.5, Diff: 0.5, Sum: 1.5]
      [Code Root Scanning (ms): Min: 0.0, Avg: 2.7, Max: 5.1, Diff: 5.1, Sum: 16.1]
      [Object Copy (ms): Min: 25.6, Avg: 28.7, Max: 31.6, Diff: 6.1, Sum: 172.4]
      [Termination (ms): Min: 0.0, Avg: 0.0, Max: 0.0, Diff: 0.0, Sum: 0.2]
         [Termination Attempts: Min: 1, Avg: 132.5, Max: 169, Diff: 168, Sum: 795]
      [GC Worker Other (ms): Min: 0.0, Avg: 0.1, Max: 0.1, Diff: 0.1, Sum: 0.4]
      [GC Worker Total (ms): Min: 33.7, Avg: 33.8, Max: 33.8, Diff: 0.1, Sum: 202.7]
      [GC Worker End (ms): Min: 11852903.7, Avg: 11852903.7, Max: 11852903.7, Diff: 0.1]
   [Code Root Fixup: 0.6 ms]
   [Code Root Purge: 0.0 ms]
   [Clear CT: 0.3 ms]
   [Other: 12.5 ms]
      [Choose CSet: 0.0 ms]
      [Ref Proc: 9.7 ms]
      [Ref Enq: 0.1 ms]
      [Redirty Cards: 0.1 ms]
      [Humongous Register: 0.1 ms]
      [Humongous Reclaim: 0.0 ms]
      [Free CSet: 2.0 ms]
   [Eden: 1179.0M(1179.0M)->0.0B(1188.0M) Survivors: 49.0M->40.0M Heap: 1232.0M(2048.0M)->44.0M(2048.0M)]
 [Times: user=0.24 sys=0.01, real=0.05 secs]
新版本 G1 日志
[0.008s][info][gc] Using G1
[0.009s][info][gc,init] Version: 17+0 (release)
[0.009s][info][gc,init] CPUs: 8 total, 8 available
[0.009s][info][gc,init] Memory: 16384M
[0.009s][info][gc,init] Large Page Support: Disabled
[0.009s][info][gc,init] NUMA Support: Disabled
[0.009s][info][gc,init] Compressed Oops: Enabled (Zero based)
[0.009s][info][gc,init] Heap Region Size: 1M
[0.009s][info][gc,init] Heap Min Capacity: 8M
[0.009s][info][gc,init] Heap Initial Capacity: 256M
[0.009s][info][gc,init] Heap Max Capacity: 2G
[0.009s][info][gc,init] Pre-touch: Disabled
[0.009s][info][gc,init] Parallel Workers: 8
[0.009s][info][gc,init] Concurrent Workers: 2
[0.009s][info][gc,init] Concurrent Refinement Workers: 8
[0.009s][info][gc,init] Periodic GC: Disabled
[0.010s][info][gc,metaspace] CDS archive(s) mapped at: [0x0000000800000000-0x0000000800bd0000-0x0000000800bd0000), size 12386304, SharedBaseAddress: 0x0000000800000000, ArchiveRelocationMode: 0.
[0.010s][info][gc,metaspace] Compressed class space mapped at: 0x0000000800c00000-0x0000000840c00000, reserved size: 1073741824
ZGC 日志
[0.010s][info][gc,init] Initializing The Z Garbage Collector
[0.010s][info][gc,init] Version: 17+0 (release)
[0.010s][info][gc,init] NUMA Support: Disabled
[0.010s][info][gc,init] CPUs: 8 total, 8 available
[0.010s][info][gc,init] Memory: 16384M
[0.010s][info][gc,init] Large Page Support: Disabled
[0.010s][info][gc,init] GC Workers: 2 (dynamic)
[0.010s][info][gc,init] Address Space Type: Contiguous/Unrestricted/Complete
[0.010s][info][gc,init] Address Space Size: 32768M x 3 = 98304M
[0.010s][info][gc,init] Min Capacity: 8M
[0.010s][info][gc,init] Initial Capacity: 256M
[0.010s][info][gc,init] Max Capacity: 2048M
[0.010s][info][gc,init] Medium Page Size: 32M
[0.010s][info][gc,init] Pre-touch: Disabled
[0.010s][info][gc,init] Uncommit: Enabled
[0.010s][info][gc,init] Uncommit Delay: 300s
[0.010s][info][gc,init] Runtime Workers: 5
[0.010s][info][gc     ] Using The Z Garbage Collector
[0.011s][info][gc,metaspace] CDS archive(s) mapped at: [0x0000000800000000-0x0000000800ba8000-0x0000000800ba8000), size 12222464, SharedBaseAddress: 0x0000000800000000, ArchiveRelocationMode: 0.
[0.011s][info][gc,metaspace] Compressed class space mapped at: 0x0000000800c00000-0x0000000840c00000, reserved size: 1073741824
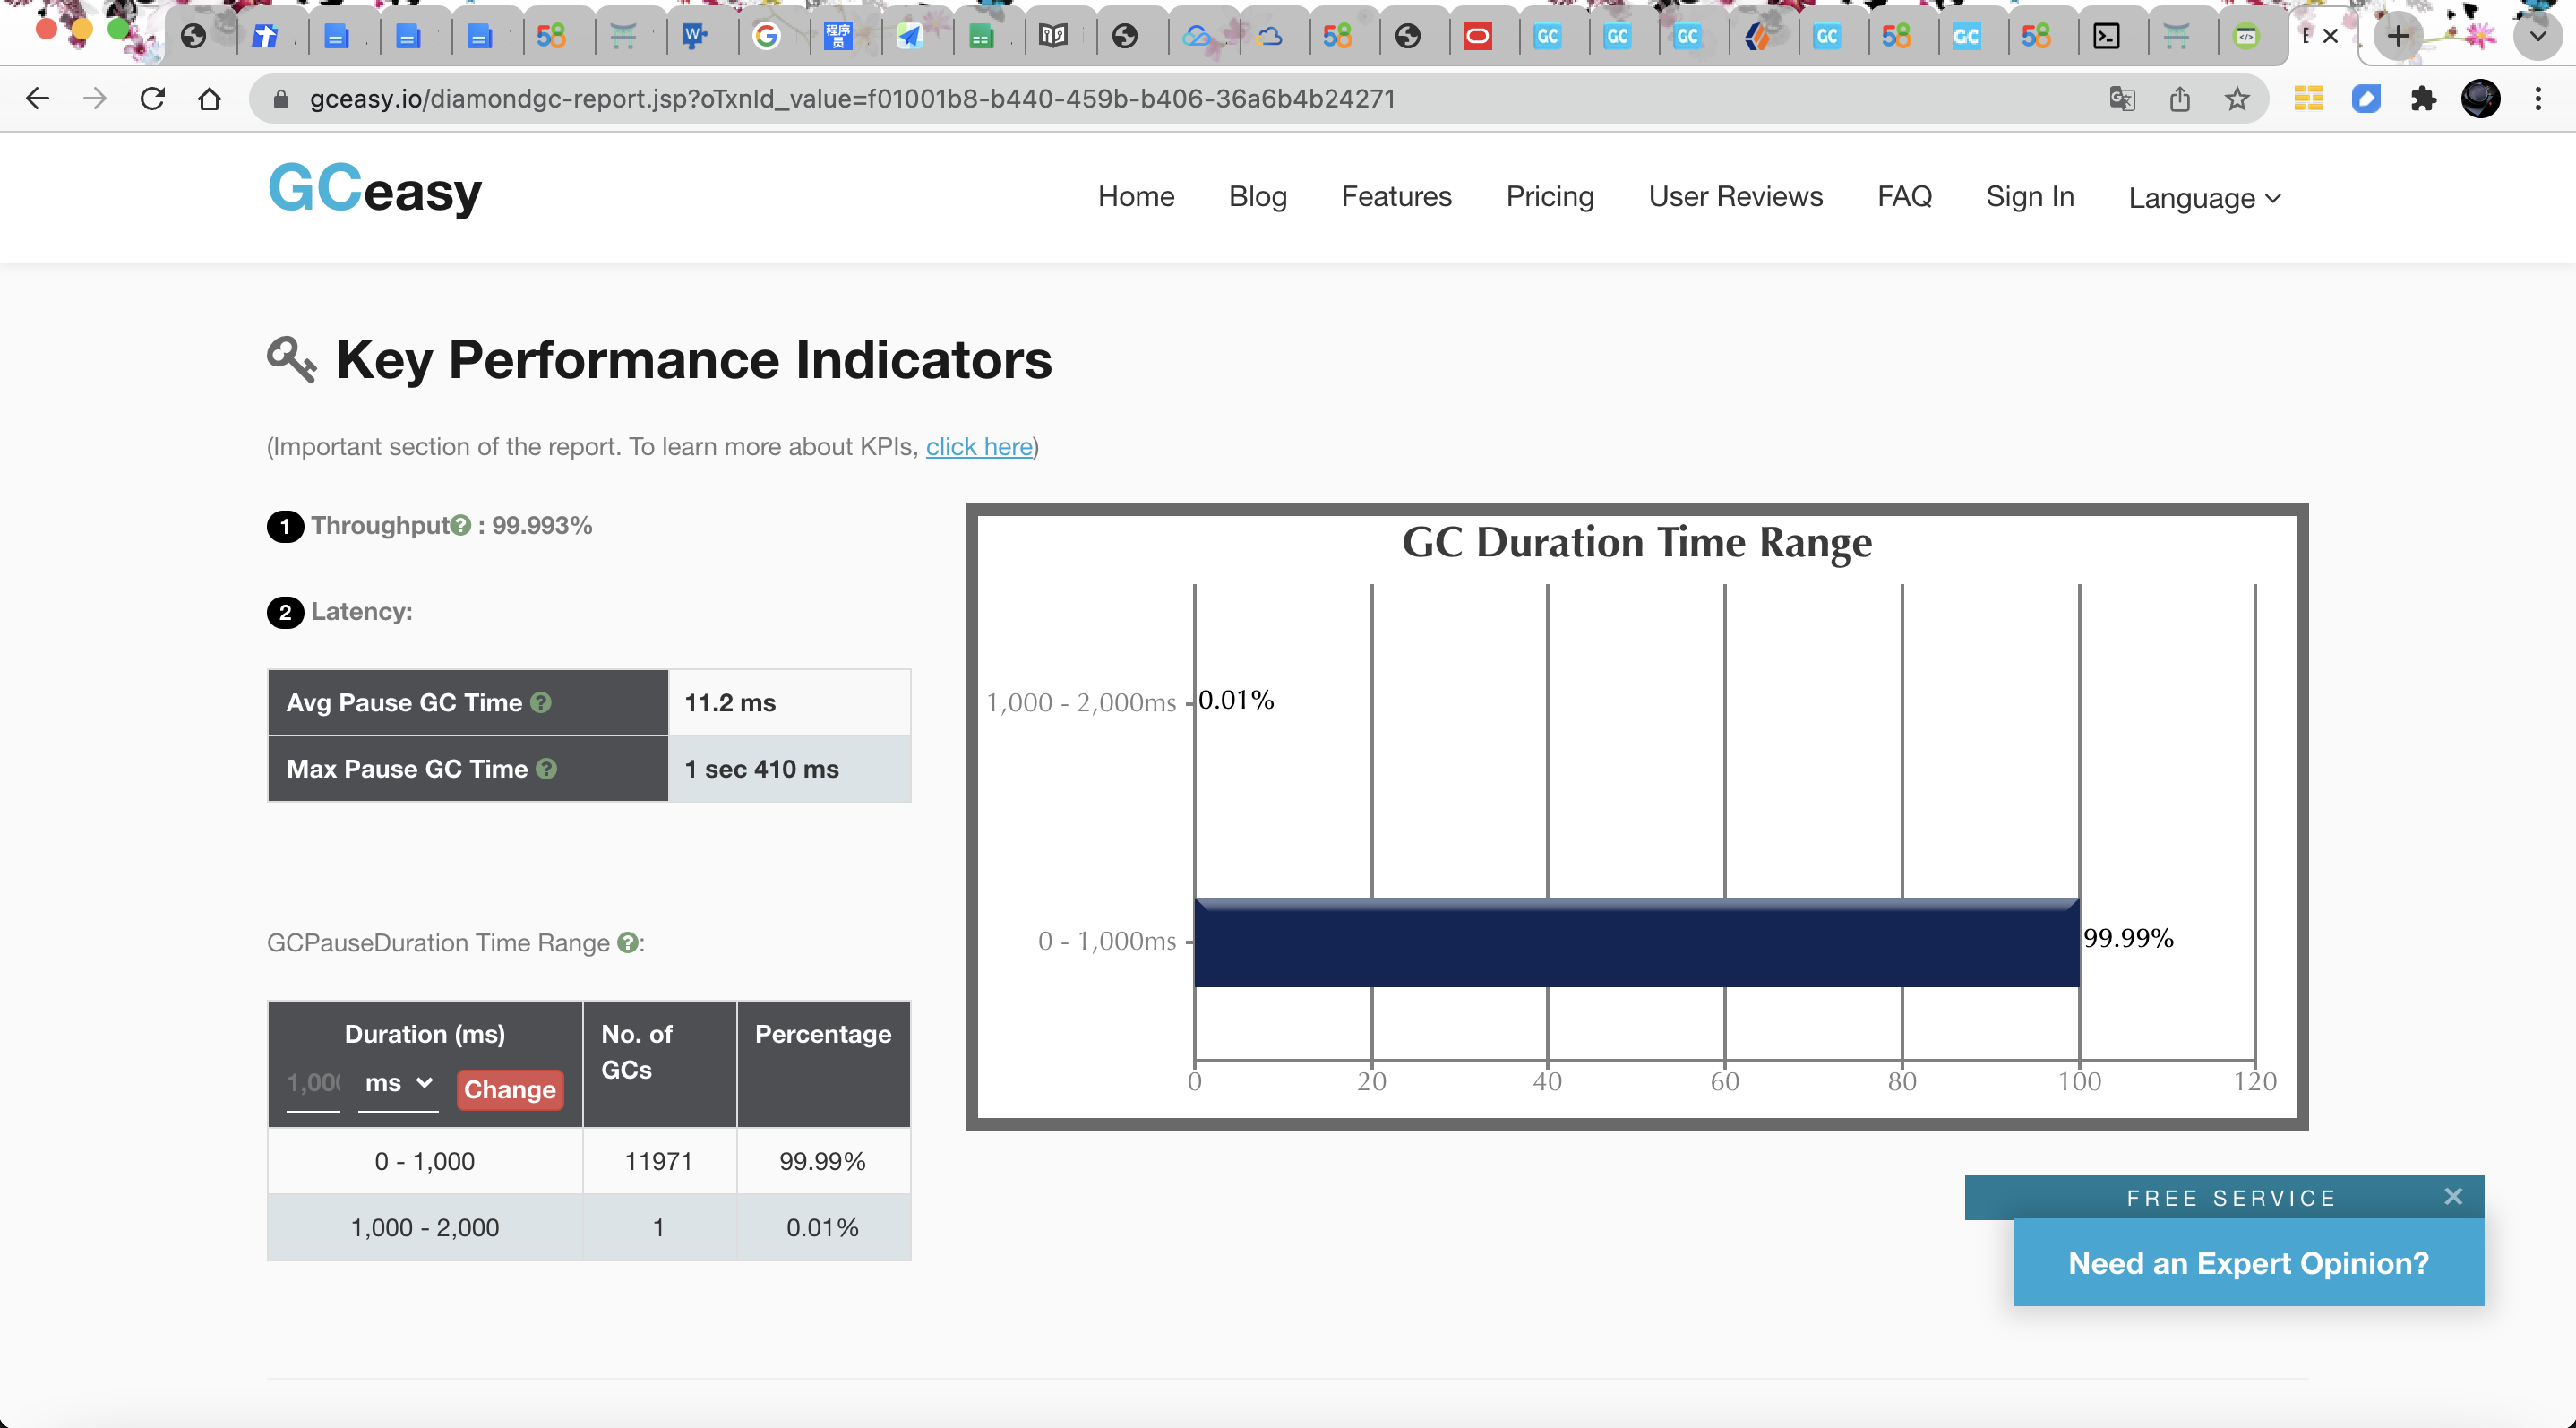
所以在分析初级阶段,可以借助一些来工具来完成gc日志的分析,GCEasy就是一款智能gc日志分析工具,在页面上选择gc日志并上传,过一会就能看到gc日志分析结果,其中还包含了gc最重要的吞吐量和STW时间结果。
笔者在此提供一份生产环境的gc日志供读者进行分析
gc日志地址:
总结
JEP158 大大提升了jvm日志的可读性和结构化,全方位提升了jvm的可观测性。开启GC日志的成本足够低, 在当今复杂多变的时代下,非常推荐升级jvm版本以获取更好的可观测性体验。